MARKET Watch
by Romulus at Grok TradeA 700% return. In one year. That is amazing. Especially for a company that was already worth billions of dollars.
On Jan. 4, 2021, I spoke with an investor who was new to the markets. He asked me what I thought about Tesla. I told him it was a great company that already changed the world, but the stock wasn’t going to do much this year.
Then he said something that blew my mind. “You don’t think Tesla will go up another 700% this year?”
“Well, if that happens, it will be worth more than Apple, Microsoft, Facebook and Google, combined! The odds of that happening are zero,” I responded.
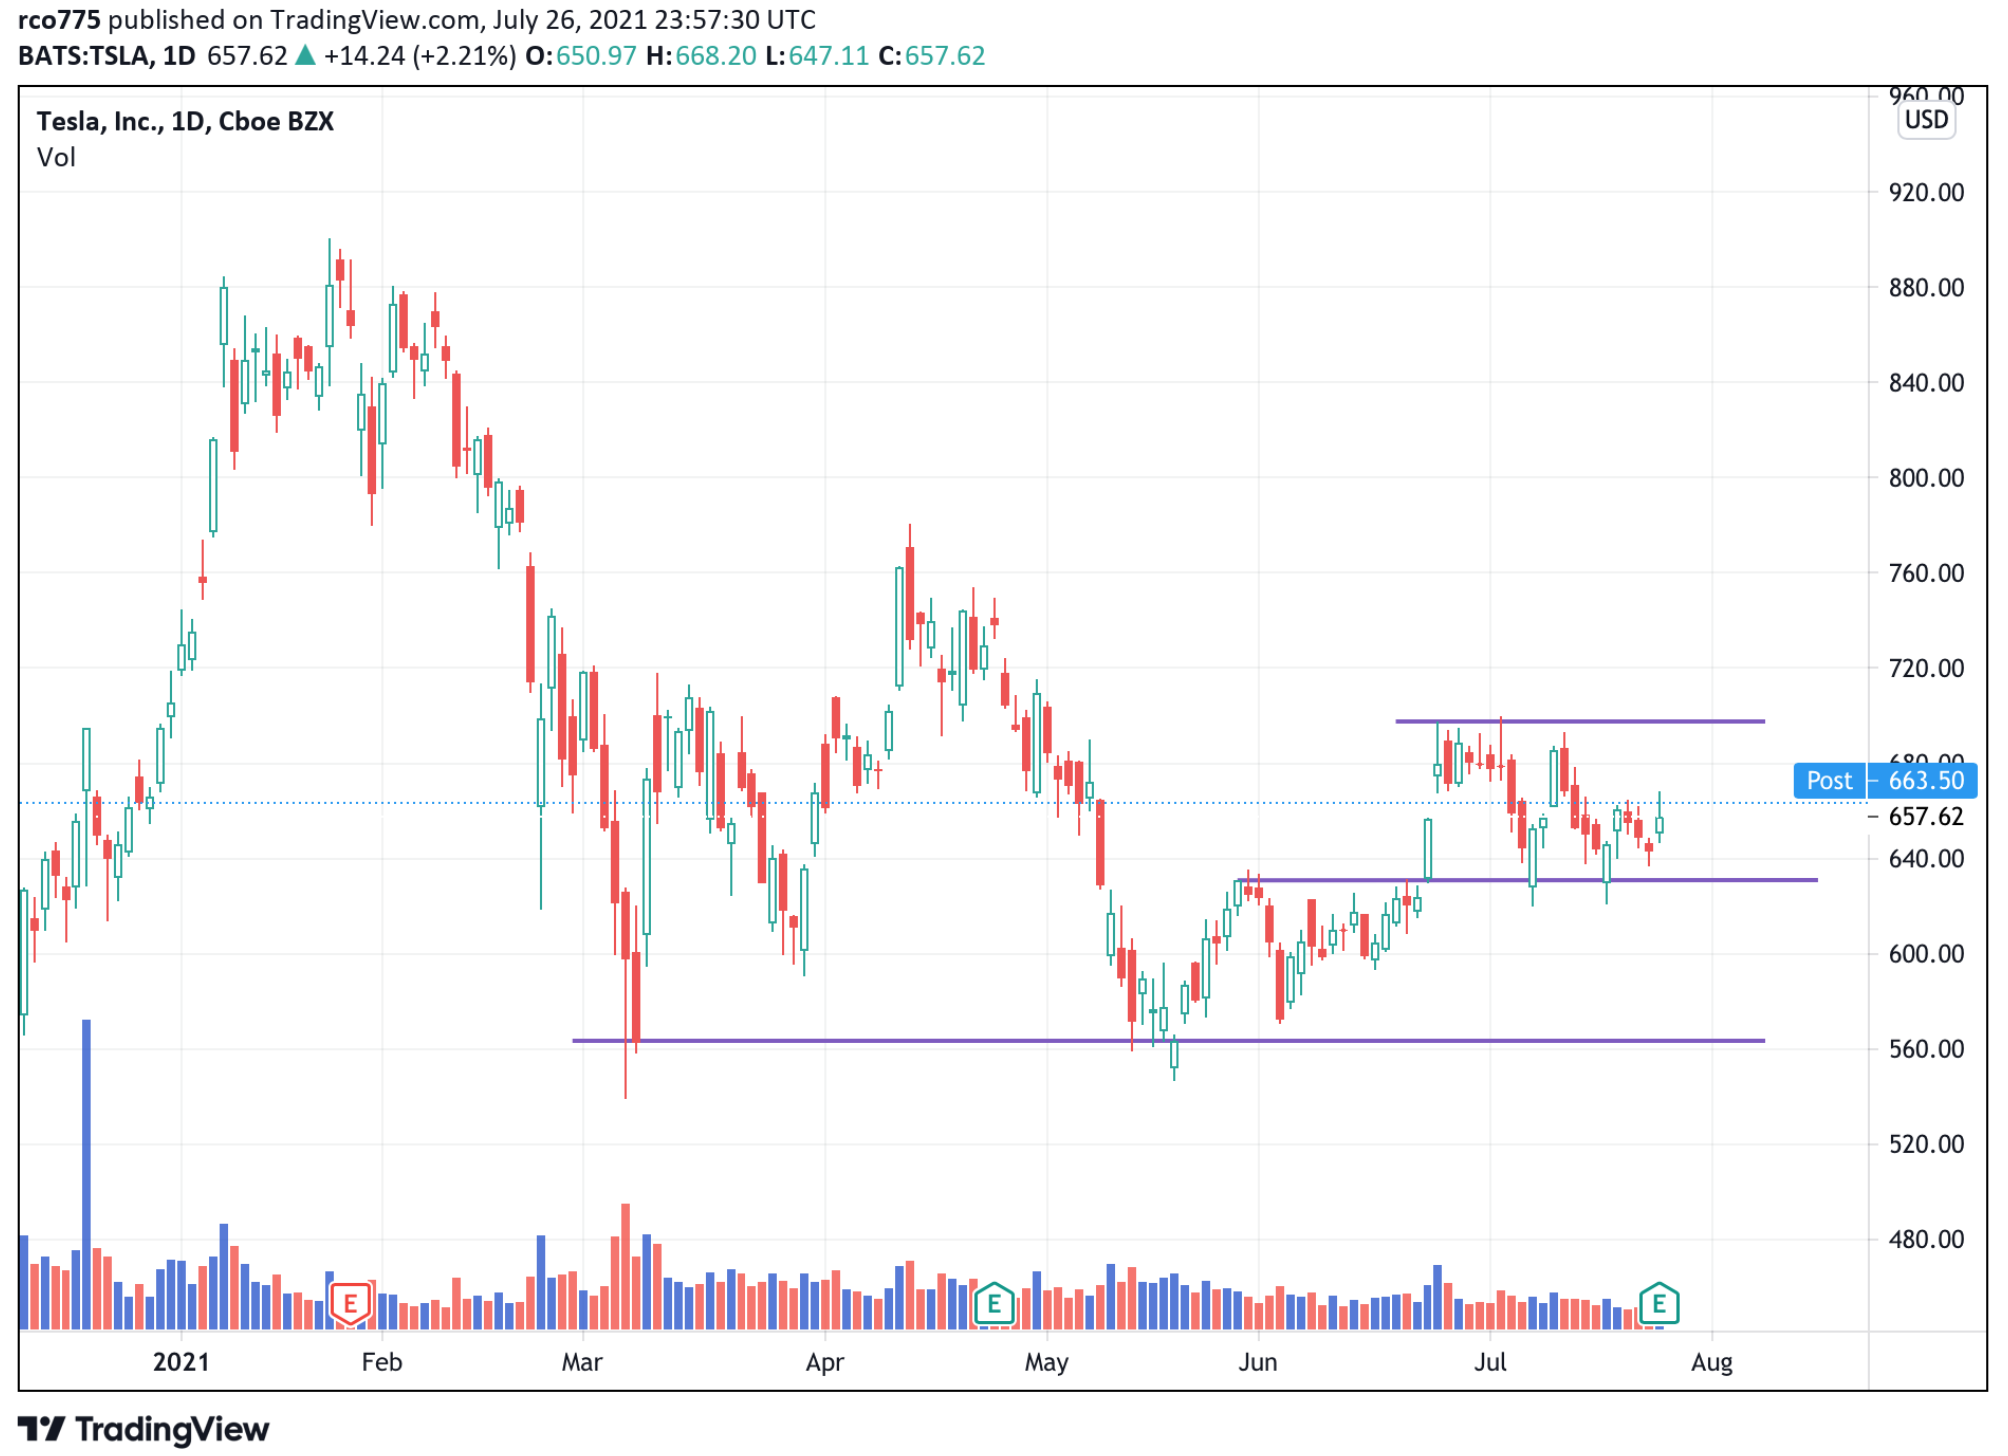
Here we are, seven months into 2021 and Tesla (TSLA) is down more than 7% on the year. Obviously, the stock is not going up 700% this year, but let’s look at the chart and see if it can get something going in the near term.

There is a slight up-trend in place since the May 19th low of $547 a share. This up-trend is supported by a still rising 200-day moving average, which is the big red line. However, the vertical lines on the bottom of the price chart represent daily volume of shares traded, which has been slowly declining the last several months. This is not a positive development as it shows a decrease in buying interest.
Last year Tesla was the hottest stock in the world. It seems to be losing favor this year.
The last two earnings reports started price slides for TSLA that lasted about a month before price found support at just over $550 a share. There is a difference this time, however. The stock ran up before the last two reports as investors anticipated super-duper results. Reality then set in and the stock deflated. This time the stock did not run up before the earnings release. That could be a positive, because lowered expectations could prompt more buying after Monday evening's positive news.
The purple line you see at $700 a share was a high base formation that typically resolves in further upside activity. On July 2, price did break above that line with enough room to trigger a traditional buy signal for traders — which it did, but temporarily. The breakout quickly failed taking the stock down to $620 a few days later.
It remains stuck in that range, for now.
The real problem for Tesla is the pattern of ever diminishing swings-high in price. Called a "descending triangle" by technical analysts, it means that traders and investors entering long positions are experiencing less and less return over time. As a result, this pattern normally portends a loss of interest and lower prices in the future.
That said, it could be weeks or months before the loss of interest and price is realized.
If it does break down, the next level of long-term support is around $450, a 30% drop from current levels. TSLA is unlikely to see that type of selling pressure with the general stock market still in a decent bull mode, but the prospects of a TSLA stock price rally in the near-term is not looking that electric.
Remember:
Wealth, like Rome, cannot be built in a day. But like Rome, it can be lost in a day.
Wealth, like Rome, cannot be built in a day. But like Rome, it can be lost in a day.
Romulus started on Wall Street in 1994 and traded for a hedge fund for 13 years. For the past 12 months he has been a teacher and mentor working for Grok Trade, a stock trading educational company in business since 2007.
INFORMATION WORLD WAR: How We Win . . . . Executive Intelligence Brief


